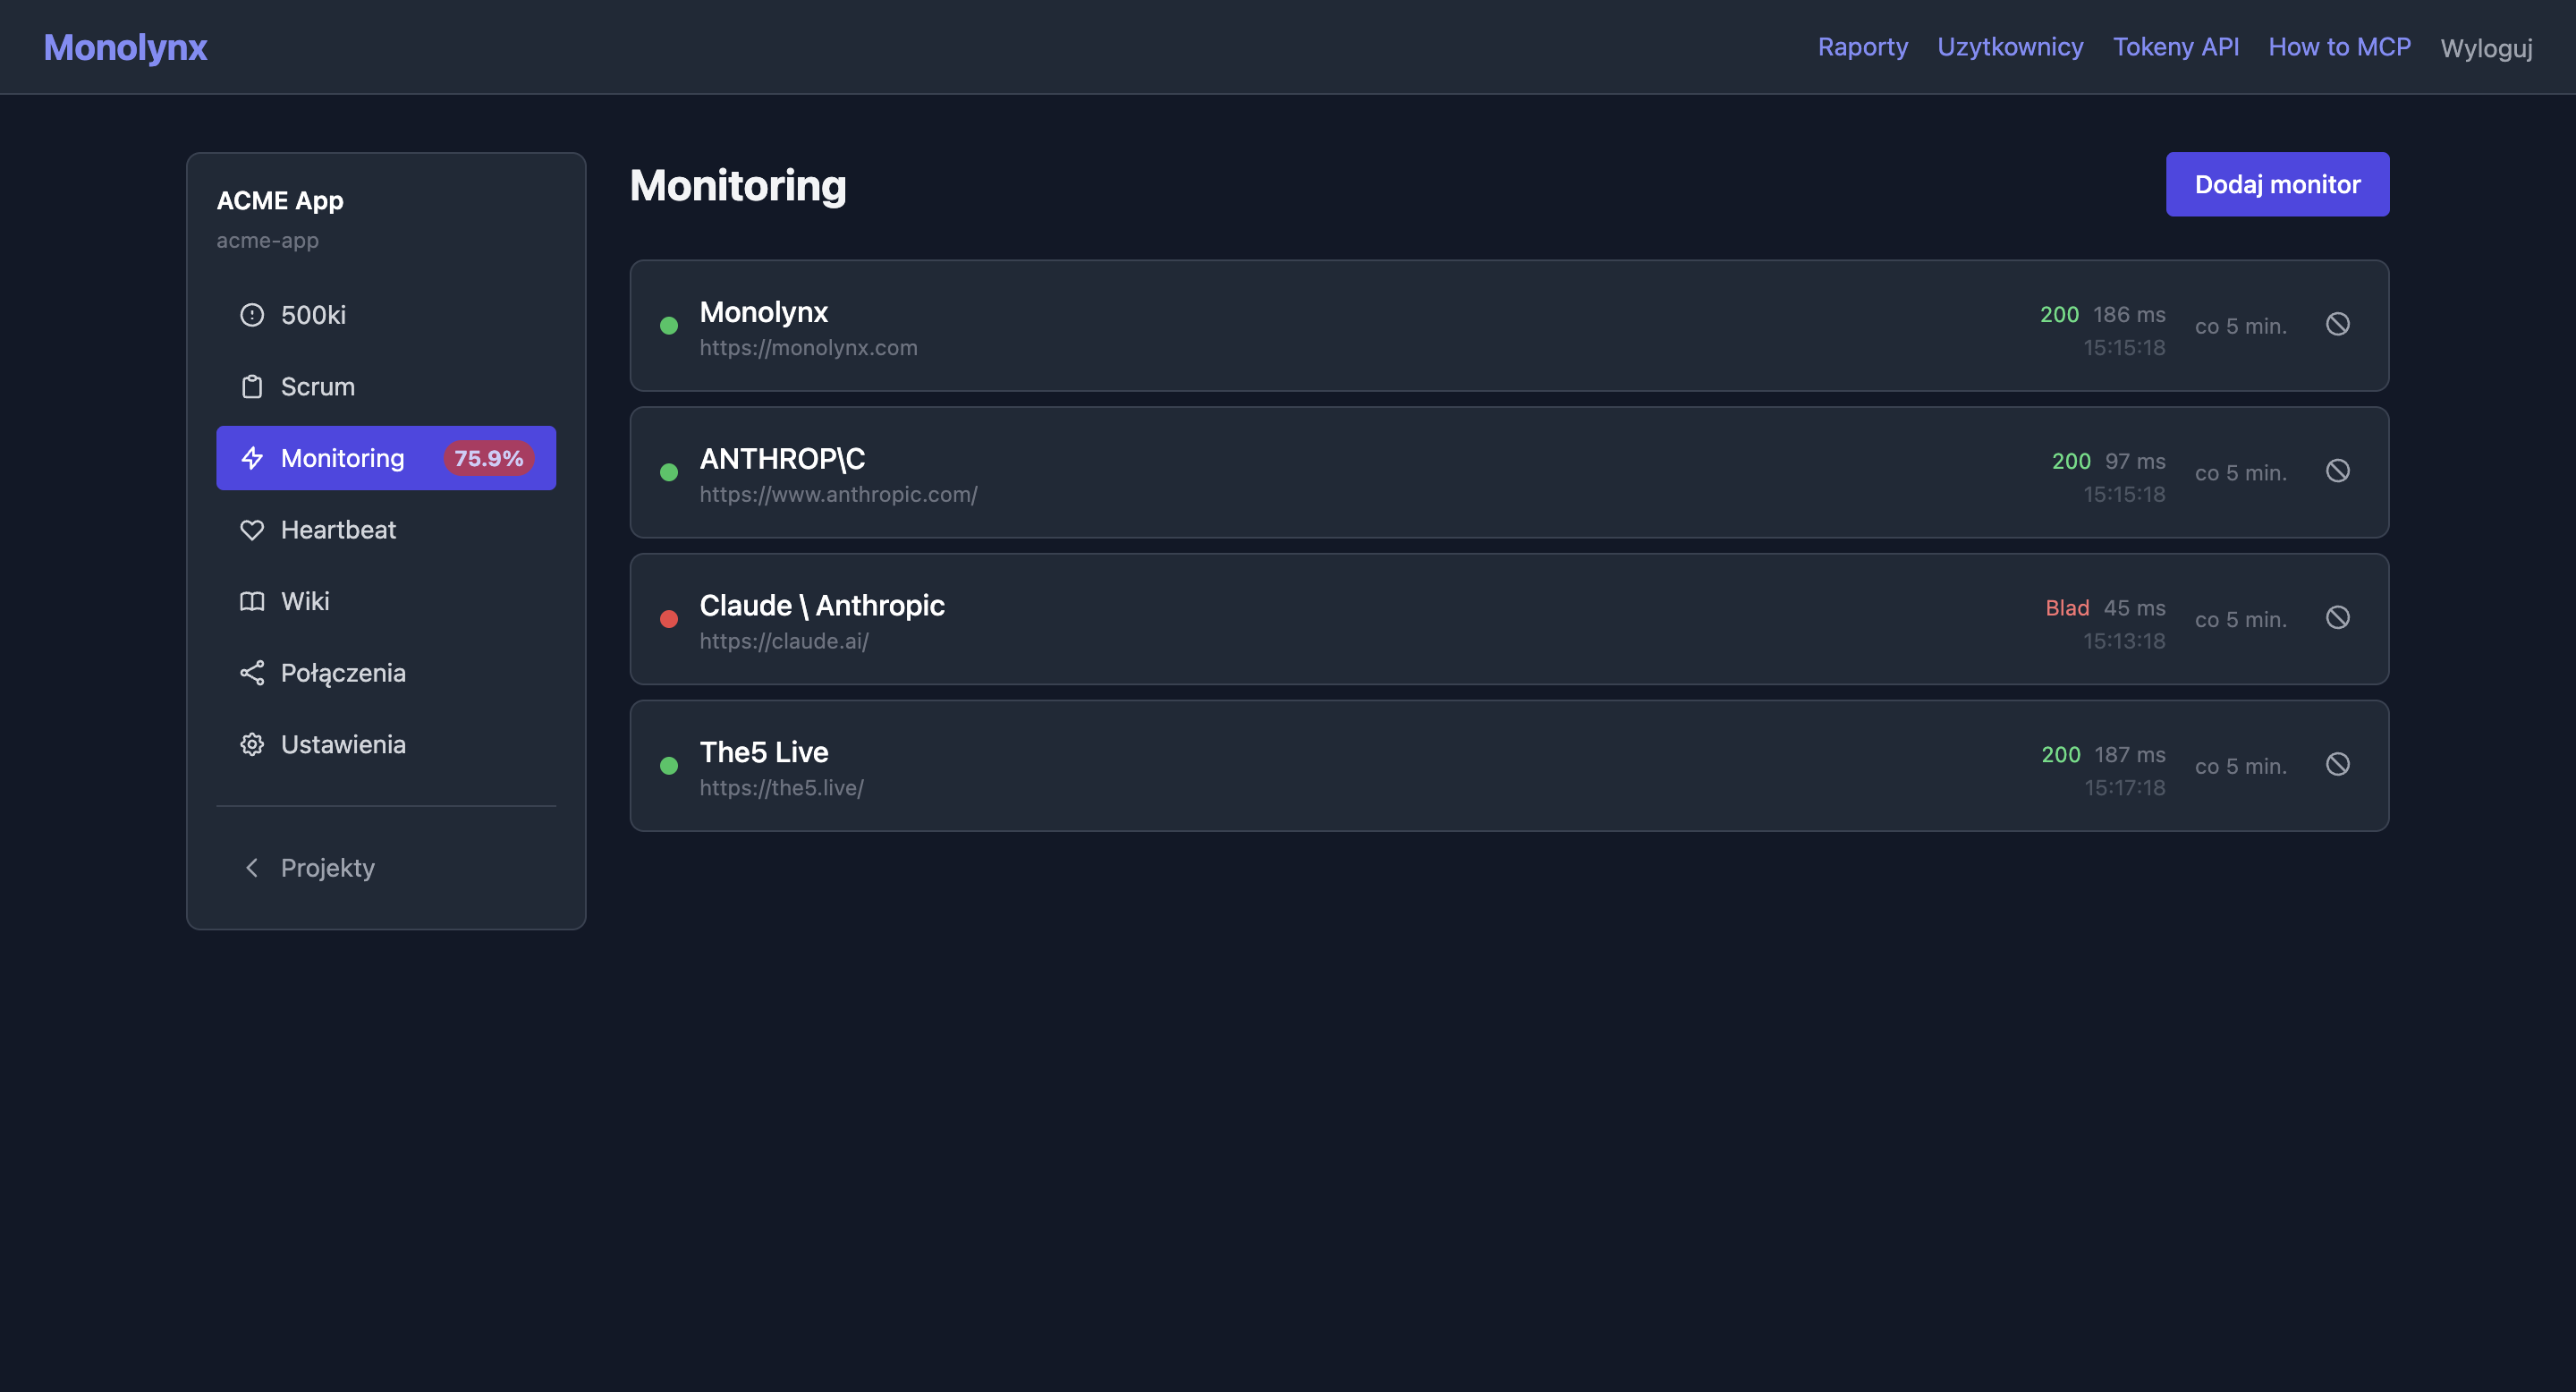
Monitor URL availability with configurable intervals. Track uptime over 24h, 7 days, and 30 days, measure response times, and browse full check history.
Check every minutes, hours, or days. Flexible units stored as raw values in the database.
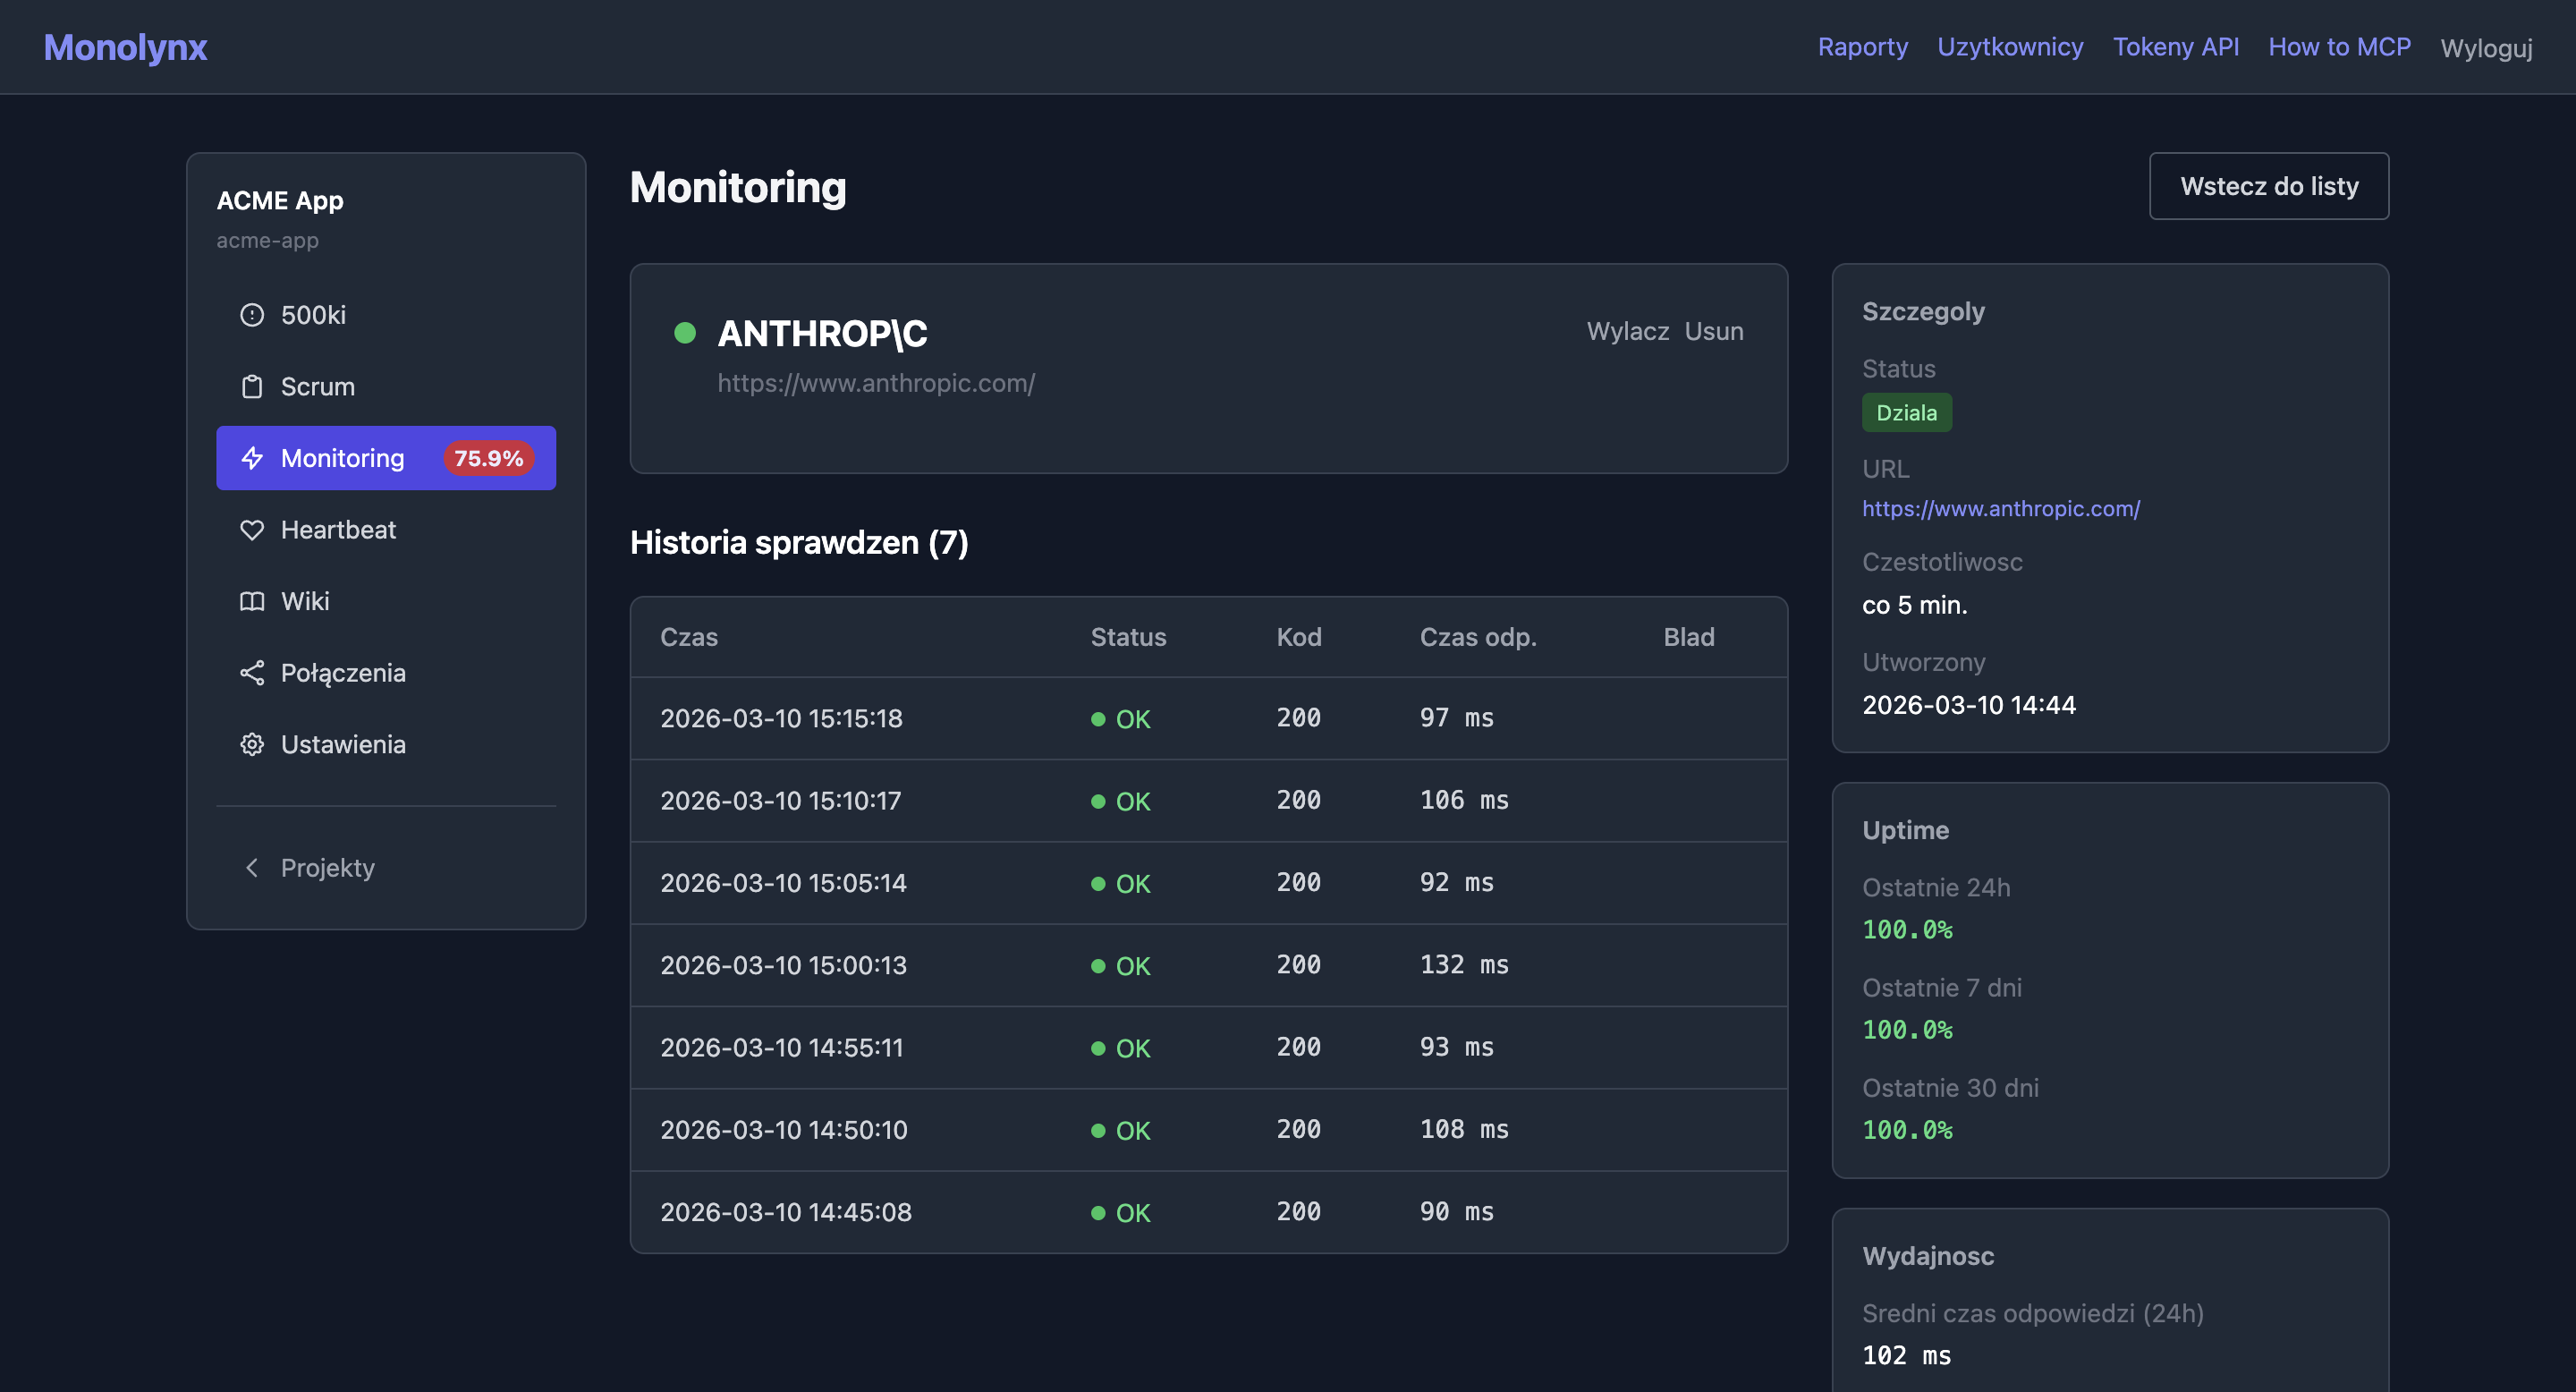
Availability percentage computed with SQL CASE statement. See the trend at a glance.
Time in milliseconds for each check. Average time from last 24h displayed on detail page.
25 checks per page. Each with status (success/error), response time, and timestamp.
On/off toggle pauses monitoring without losing history and configuration.
Blocks localhost, private IPs, and link-local addresses. Resolves DNS and validates IP before making the request.
Enter URL and check interval (e.g., every 5 minutes). Maximum 20 monitors per project.
Separate worker process makes HTTP requests in the background with asyncio.gather() for concurrent checks.
Each check is a database record: timestamp, response time (ms), success/failure.
Detail page shows uptime trend, average response time, and full history.
Your AI agent can create, edit, and delete monitors, track status and metrics — 5 MCP tools.
Available MCP tools
list_monitors
All monitors with last check status
get_monitor
Full history with pagination, uptime metrics, average response time
create_monitor
Create a new URL monitor with interval and expected status
update_monitor
Edit monitor name, URL, interval or expected status
delete_monitor
Delete a monitor with its check history
Error tracking
Agile project management
Cron job monitoring
Documentation & RAG search
Dependency graph
Work analytics & PDF export
Cross-project billing & attachments
Personal cross-project scheduling
AI agent work observability